Access high-resolution water table depth dataset (ma_2025)
To launch this notebook interactively in a Jupyter notebook-like browser interface, please click the “Launch Binder” button below. Note that Binder may take several minutes to launch.

This notebook provides a walk-through of how to access the high-resolution water table depth dataset described in Ma et. al 2025.
This dataset is too large to download in a single API query. Please visit hydrogen.princeton.edu and use the Map Controls menu on the left to “Explore Gridded Conditions”. You can interactively view the entire dataset by selecting the “Water Table Depth” variable and “ma_2025” dataset. This example notebook shows how to query and plot a subset of the dataset.
Please see the full ma_2025 dataset documentation page for data processing notes and the grid definition.
[3]:
# Import packages
from matplotlib import pyplot as plt
import pandas as pd
import hf_hydrodata as hf
[ ]:
# You need to register on https://hydrogen.princeton.edu/pin
# and run the following with your registered information
# before you can use the hydrodata utilities
hf.register_api_pin("your_email", "your_pin")
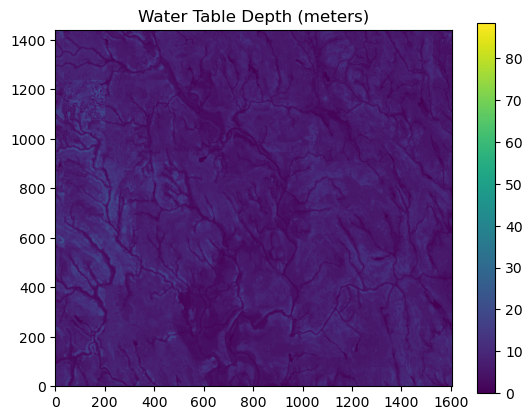
Example: Subset to a bounding box using a HUC ID
[6]:
options = {
    "dataset": "ma_2025",
    "variable": "water_table_depth",
    "grid": "conus2_wtd.30",
    "huc_id": "02080203"
}

wtd_data_huc = hf.get_gridded_data(options).squeeze()
[7]:
# Visualize the data subset
plt.imshow(wtd_data_huc, cmap='viridis', origin='lower')
plt.colorbar()
plt.title('Water Table Depth (meters)')
plt.show()
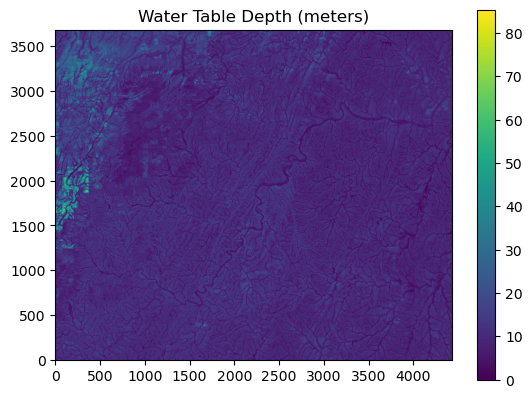
Example: Subset using a latitude/longitude bounding box
[8]:
options = {
    "dataset": "ma_2025",
    "variable": "water_table_depth",
    "grid": "conus2_wtd.30",
    "latlng_bounds": [42.6, -72.8, 42.8, -72.2]
}

wtd_data_bbox = hf.get_gridded_data(options).squeeze()
[9]:
# Visualize the data subset
plt.imshow(wtd_data_bbox, cmap='viridis', origin='lower')
plt.colorbar()
plt.title('Water Table Depth (meters)')
plt.show()